移動平均(numpy.convolve利用)
移動平均の関数のテスト。
numpy.convolveは、以下が想定とちょっと違ったので。
- 平均の範囲
- 戻ってくる大きさ

想定
- 入力と出力が同じ大きさの配列
- 2次元配列を処理してほしい
- データがないところはNAN
プログラム
入力と同じ大きさのnanを用意しておく。
numpy.convolveは、mode=validで計算して、値があるところだけ値を書き込み。
import numpy as np

def movingaverage(data_2d,axis=1,windowsize=3):
    answer = np.zeros((data_2d.shape))
    answer[:,:] = np.nan

    v = np.ones(windowsize,)/windowsize

    for i in range(data.shape[axis]):
        if axis==0:
            answer[i,windowsize-1:]=np.convolve(data_2d[i,:], v, mode = "valid")
        if axis==1:
            answer[windowsize-1:,i]=np.convolve(data_2d[:,i], v, mode = "valid")
        answer=answer
    return answer

#4列のデータが8点
data=np.arange(32)
data=data.reshape(8,4)
print("元データ")
print(data)
print("横方向で平均")
answer = movingaverage(data,axis=0,windowsize=3)#横方向で平均
print(answer)
print("縦方向で平均")
answer = movingaverage(data,axis=1,windowsize=3)#縦方向で平均
print(answer)
実行結果
元データ
[[ 0  1  2  3]
 [ 4  5  6  7]
 [ 8  9 10 11]
 [12 13 14 15]
 [16 17 18 19]
 [20 21 22 23]
 [24 25 26 27]
 [28 29 30 31]]
横方向で平均
[[nan nan  1.  2.]
 [nan nan  5.  6.]
 [nan nan  9. 10.]
 [nan nan 13. 14.]
 [nan nan 17. 18.]
 [nan nan 21. 22.]
 [nan nan 25. 26.]
 [nan nan 29. 30.]]
縦方向で平均
[[nan nan nan nan]
 [nan nan nan nan]
 [ 4.  5.  6.  7.]
 [ 8.  9. 10. 11.]
 [12. 13. 14. 15.]
 [16. 17. 18. 19.]
 [20. 21. 22. 23.]
 [24. 25. 26. 27.]]
より大きな値の数や割合
こんな感じ。要素数で割れば、割合がわかる。
for文を回さなくていいので、numpy便利。
>>> import numpy as np
>>>
>>> a=np.array([71,77,80,80,89,83])
>>> b=np.sum(a>=80)
>>> print(b)
4
実際のところTrueを1として計算してくれている。
>>> c=a>=80
>>> c
array([False, False,  True,  True,  True,  True])
>>> c.astype(int)
array([0, 0, 1, 1, 1, 1])
移動分散のサンプルプログラム
移動分散のサンプルプログラム
プログラム
import numpy as np
a=np.array([71,77,80,80,89,83])

windowsize=3

for i in range(a.shape[0]-windowsize):
    print("print a[{0}:{1}]".format(i,i+windowsize))
    np.std(a[i:i+windowsize])
実行結果
print a[0:3]
3.7416573867739413
print a[1:4]
1.4142135623730951
print a[2:5]
4.242640687119285
ujsonのインストールができない
解決方法
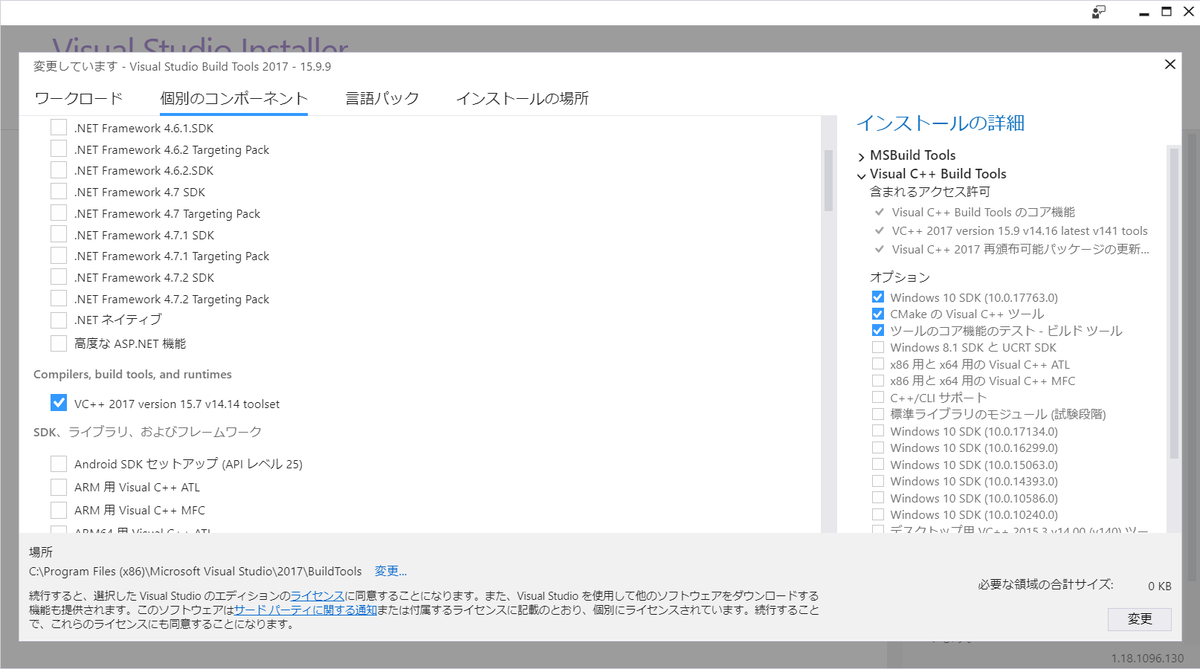
- https://visualstudio.microsoft.com/downloads/から、下のほうにある、Build Tools for Visual Studio 2017 をダウンロード。
- 実行して、以下を選択してインストール

留意事項
試行錯誤中に、Visul Studio 2015のbulid toolsも入れた(それだけではエラーは変わらず)。上記解決方法で解決しない場合はインストールする。
https://www.microsoft.com/ja-JP/download/details.aspx?id=48159
エラー内容
pip install ujsonの時のエラーの内容は以下。
(base) C:\WINDOWS\system32>pip install ujson
Collecting ujson
  Using cached https://files.pythonhosted.org/packages/16/c4/79f3409bc710559015464e5f49b9879430d8f87498ecdc335899732e5377/ujson-1.35.tar.gz
Building wheels for collected packages: ujson
  Building wheel for ujson (setup.py) ... error
  Complete output from command C:\ProgramData\Anaconda3\python.exe -u -c "import setuptools, tokenize;__file__='C:\\Users\\<username>\\AppData\\Local\\Temp\\pip-install-hvxfwwjm\\ujson\\setup.py';f=getattr(tokenize, 'open', open)(__file__);code=f.read().replace('\r\n', '\n');f.close();exec(compile(code, __file__, 'exec'))" bdist_wheel -d C:\Users\dial8\AppData\Local\Temp\pip-wheel-7j8d0yrz --python-tag cp37:
  Warning: 'classifiers' should be a list, got type 'filter'
  running bdist_wheel
  running build
  running build_ext
  building 'ujson' extension
  error: Microsoft Visual C++ 14.0 is required. Get it with "Microsoft Visual C++ Build Tools": https://visualstudio.microsoft.com/downloads/

  ----------------------------------------
  Failed building wheel for ujson
  Running setup.py clean for ujson
Failed to build ujson
Installing collected packages: ujson
  Running setup.py install for ujson ... error
    Complete output from command C:\ProgramData\Anaconda3\python.exe -u -c "import setuptools, tokenize;__file__='C:\\Users\\<username>\\AppData\\Local\\Temp\\pip-install-hvxfwwjm\\ujson\\setup.py';f=getattr(tokenize, 'open', open)(__file__);code=f.read().replace('\r\n', '\n');f.close();exec(compile(code, __file__, 'exec'))" install --record C:\Users\dial8\AppData\Local\Temp\pip-record-48ijrvtr\install-record.txt --single-version-externally-managed --compile:
    Warning: 'classifiers' should be a list, got type 'filter'
    running install
    running build
    running build_ext
    building 'ujson' extension
    error: Microsoft Visual C++ 14.0 is required. Get it with "Microsoft Visual C++ Build Tools": https://visualstudio.microsoft.com/downloads/

    ----------------------------------------
Command "C:\ProgramData\Anaconda3\python.exe -u -c "import setuptools, tokenize;__file__='C:\\Users\\<username>\\AppData\\Local\\Temp\\pip-install-hvxfwwjm\\ujson\\setup.py';f=getattr(tokenize, 'open', open)(__file__);code=f.read().replace('\r\n', '\n');f.close();exec(compile(code, __file__, 'exec'))" install --record C:\Users\dial8\AppData\Local\Temp\pip-record-48ijrvtr\install-record.txt --single-version-externally-managed --compile" failed with error code 1 in C:\Users\dial8\AppData\Local\Temp\pip-install-hvxfwwjm\ujson\

(base) C:\WINDOWS\system32>
matplotlibの日本語対応
plotに日本語を含めていると化けるので、日本語フォントを使えるようにする。
matplotlibのフォントディレクトリに対応フォントを入れて、fontlistを更新する。
事前準備
- https://ipafont.ipa.go.jp/ から、フォントファイルをダウンロードする。
- C:\ProgramData\Anaconda3\Lib\site-packages\matplotlib\mpl-data\fonts\ttf に、フォントファイル(ipaexg.ttf)を保存する。
- 次のコードを実行する。フォントのリビルド(※)
import matplotlib.font_manager as fm
fm._rebuild()
実際に日本語をプロットするとき
- 日本語をプロットしたい.pyファイルの中で、以下の1文をれておく
import matplotlib.pyplot as plt
plt.rcParams["font.family"] = "IPAexGothic"
sklearnでクラスタリング(その2)
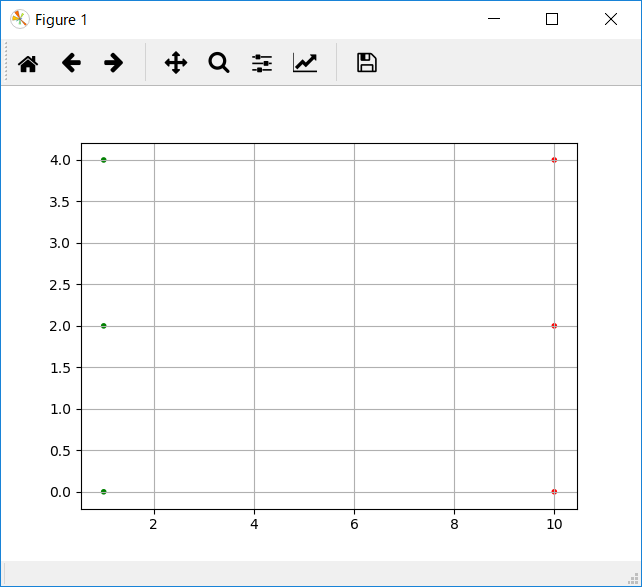
プロットするプログラムhello_scatterもつけてみた。

import numpy as np
import matplotlib.pyplot as plt
from sklearn.cluster import KMeans

def hello_kmeans_demo():
    X = np.array([[1, 2], [1, 4], [1, 0],[10, 2], [10, 4], [10, 0]])
    """
    array([[ 1,  2],
       [ 1,  4],
       [ 1,  0],
       [10,  2],
       [10,  4],
       [10,  0]])
    X.shapeは、(6,2)
    """
    kmeans = KMeans(n_clusters=2, random_state=0).fit(X)
 #クラスタリングの結果のラベルが手に入る
    Y=np.array(kmeans.labels_)

    #print("cluster_centers_",kmeans.cluster_centers_)
    #print("inertia_",kmeans.inertia_)
    #print("kmeans.n_iter_",kmeans.n_iter_)

 #プロット関数呼び出し
    hello_scatter(X,Y)

def hello_scatter(np_data,np_target=None,dim_x=0,dim_y=1):
    """
    指定された次元で、scatterプロットする。
    targetのラベルが0ならば赤、1ならば緑、2ならば青、それ以外は黒でプロット。
    """
    color_list=["black"]*np_data.shape[0]#shapeで(行,列)が返ってくるので行数分のリストを作成。
    for i in np.where(np_target==0)[0]:
        color_list[i]="red"
    for i in np.where(np_target==1)[0]:
        color_list[i]="green"
    for i in np.where(np_target==2)[0]:
        color_list[i]="blue"

    #arrayは、[行,列]で指定
    plt.scatter(x=np_data[:,dim_x], y=np_data[:,dim_y], c=color_list, marker=".")
    plt.grid(True)
    plt.show()

if __name__ == "__main__":
    hello_kmeans_demo()